Objective: To provide the reader with a broad and simplified explanation of ‘Data Activation’ within a DMP and highlight some of the factors that should be considered by an Organization when evaluating this feature.
NOTE : This document is NOT intended to be comprehensive but instead will aim to highlight the concepts of certain specific evaluation criteria that are deemed extremely important with regards to DMPs.
This document is also available in PDF form: Click to View
Table of contents
№01. [What is a DMP?](#section1-what_is_a_dmp)
№02. [The DMPs Role in Activating Data](#section2-dmp-role)
№02a. [What is Data Activation ?](#section2a-data-activation)
№02b. [How to assess a DMPs effectiveness in activating data?](#section2b-assess-effectiveness-dmp)
№000. [Info Box - What is a ‘Match Rate’?](#info1-match-rate)
№02bI. [Market Share within Target Market](#section2bi-market-share)
№02bII. [Core Clientele Type and Category](#section2bii-core-clientele)
№02bIII. [Product and/or Platform Integrations](#section2biii-platform-integrations)
№03. [Conclusive Statement](#section3-conclusive-statement)
A DMP or Data Management Platform is simply what its name describes it to be - a ‘vessel’ or bucket that collects data and subsequently aims to represent it either to internal or external platforms and/or interfaces thus enabling the end user to act on the collected datasets.
In other words - a DMP essentially functions as a ‘Data Facilitator’ within the Enterprise Advertising Technology (AdTech) and Marketing Technology (MarTech) stack.
This document will intentionally not delve further into the details of defining what is a DMP given the vast amount of already available material out there both from Vendors and Third Party Content producers such as:
In this section, the document will aim to expand upon the primary role of a DMP - which is to activate datasets - and its position as an intermediary between the AdTech stack and the rest of the Enterprise Architecture.
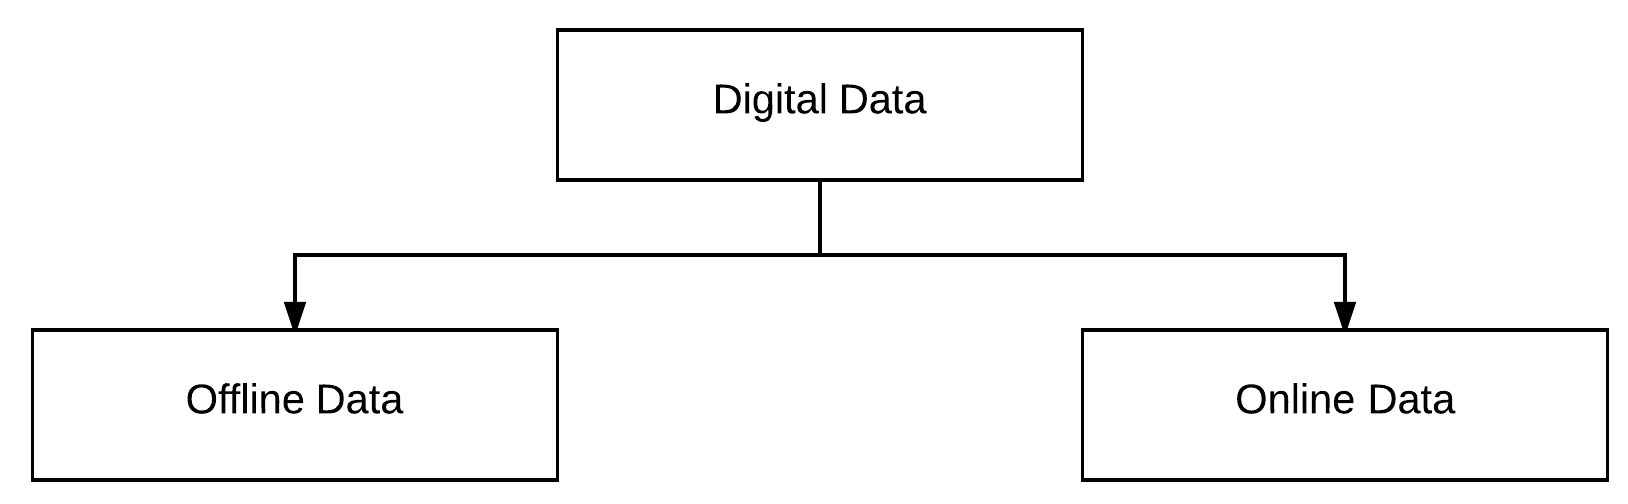
Before expanding on the definition for the above, it is important to establish that data within the context of advertising and marketing technologies exist in two categories, visualized below:
Offline Data:
Can be defined as datasets that are generally associated with ‘Personally Identifiable Information’ (PII) that is explicit provided and/or derived from the end user and is NOT attached to a digital identifier such a Cookie ID
Examples include (but are not limited to) digital form submission details such as First name, Last name, Email address, Home and/or Office Address, etc
Online Data:
Can be defined as datasets that are NOT explicitly provided by the end user but is instead collected through behavioural mechanisms such as (but not limited to) browsing the web or using a mobile application and is attached to an anonymous, non-PII digital identifier such as a Cookie ID
Examples include (but are not limited to) mobile device ID, battery ID, MAC Addresses, Analytics User ID, etc
Given the above,‘Data Activation’ can be defined as the act of creating a third, transitive or ‘bridge’ state between the two aforementioned data categories, called “Offline to Online” or “Online to Offline” depending on the initial datasets and the subsequent bridged datasets.
It is important to note that - unlike the other two categories that will remain static throughout the lifespan of the datasets, the bridge-state is continuous and thus dynamic.
Creating this transitive dataset is perhaps the most fundamental and foundational purpose of deploying a DMP within your Enterprise Architecture or your AdTech stack in particular.
How to assess a DMPs effectiveness in activating data?
#
This sub-section will aim to provide an overview into the methodology of evaluating a DMP with regards to its effectiveness in activating an Organization’s offline datasets.
NOTE : While this subsection provides a prescriptive methodology - it is important to note that it is highly reliant on the information supplied by the Vendors within your local market and the existing market restrictions and/or monopolies. Thus - the methodology will require personalization based on your niche and marketplace.
A DMPs effectiveness in activating data can be broadly assessed through a metric called ‘match rate’.
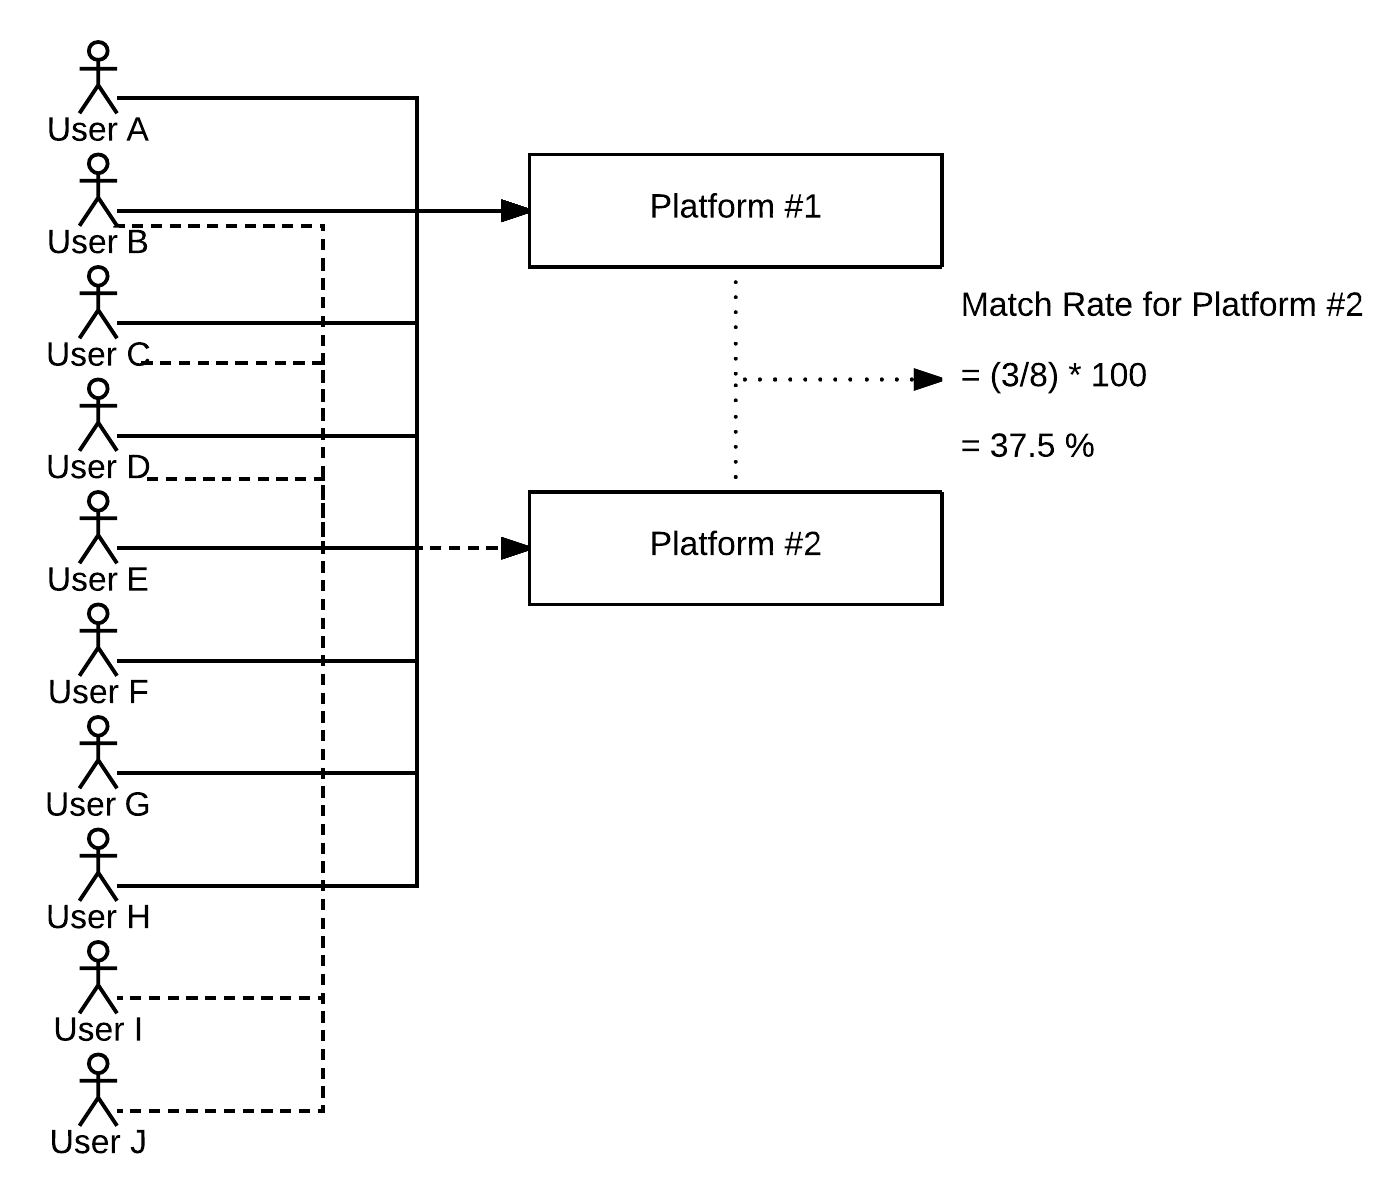
What is a ‘Match Rate’?
A ‘Match Rate’ (within the context of AdTech and MarTech) at its most fundamental level is the percentage of IDs that match between two compared datasets.
This can be broadly visualized as follows:
In the visualization above, the case assumes that Organization on Platform #2 is being onboarded to Platform #1.
Platform #1 in this scenario owns about 80% market share and is fairly popular - they can be thought of as a platform that is popular or fairly essential to an existing market. Examples include (but are not necessarily limited to) Social Media platforms such as Facebook or Financial Institutions such as a Consumer Bank.
Platform #2 in this scenario can be interpreted as a niche platform or a segmented community oriented site such as a Publisher and/or Content Producer. Examples include (but are not necessarily limited to) a National or Local Financial Newspaper or a Gaming Platform.
While the example is highly simplified - it is as so to merely provide an initial basis of understanding for the remainder of this subsection.
In general, most Organizations have two disparate data categories as per the above and are looking to activate the datasets to achieve the following example scenarios (though not necessarily limited to):
Better online targeting and retargeting for product campaigns to known users
Increased accuracy in generating look-alike audiences based on known users
Achieving this through a DMP requires the Vendor to have access to a large pool of activated IDs that can be leveraged to achieve a high ‘match rate’.
In general, assessing the quality and quantity of IDs (and Activated IDs in particular) within a DMP depends on a few key factors (though not necessarily limited to the following):
Assessing a DMPs market share requires one to assess and compare the following metrics among Vendors:
Number of unique individuals and/or profiles
Total number of Unique IDs by Device (Desktop vs Mobile)
The fundamental difference between the two is - that a unique individual may have multiple device IDs. Given so, it is important to identify is the DMP datasets is slanted towards a specific ID type and if they have those IDs activated and tagged to a unified profile.
Unified profiles with adequate tagging enables Organization to leverage this as a means of better tagging and further expanding their own digital dataset more effectively and efficiently within connected platforms.
The aforementioned metrics will also need to be contextualized based on the target geo of the Organization - which depending on the size and product and/or service type can be a mixture of the following:
Local (State, District)
National (Country)
Regional (Neighbouring Countries)
Global (Multiple Regions)
The breakdown as per above is crucial to ensure that the original claims made are market relevant to an Organization and their growth strategy.
To better understand the pool of IDs collected within the DMP platform(s) of choice, Organizations should:
Obtain a list of core ID contributors (or Clients) of the platform and their percentage of ID and profile contribution to the overall pool; and
Identify if the DMP has a Client Category Strategy
This essentially translates to finding out who contributes the biggest pool(s) of IDs within the DMP Vendor ecosystem and if the Vendor has a specific slant towards any particular type of Clientele.
Examples of Clientele slants include Publisher-heavy, Buy-Side heavy, Financial Institutions etc. This helps an Organization understand the pool better and also understand if they are in a position to leverage the marketplace either as a major contributor or grow their footprint as a large consumer.
This factor is extremely important because of Client-transitions and how it affects your Match rates.
Consider the following hypothetical and highly simplified scenario:
NOTE : While the names and URLs derived below are from External sources, the scenario below and the data presented is completely hypothetical and is meant for purely educational purposes only.
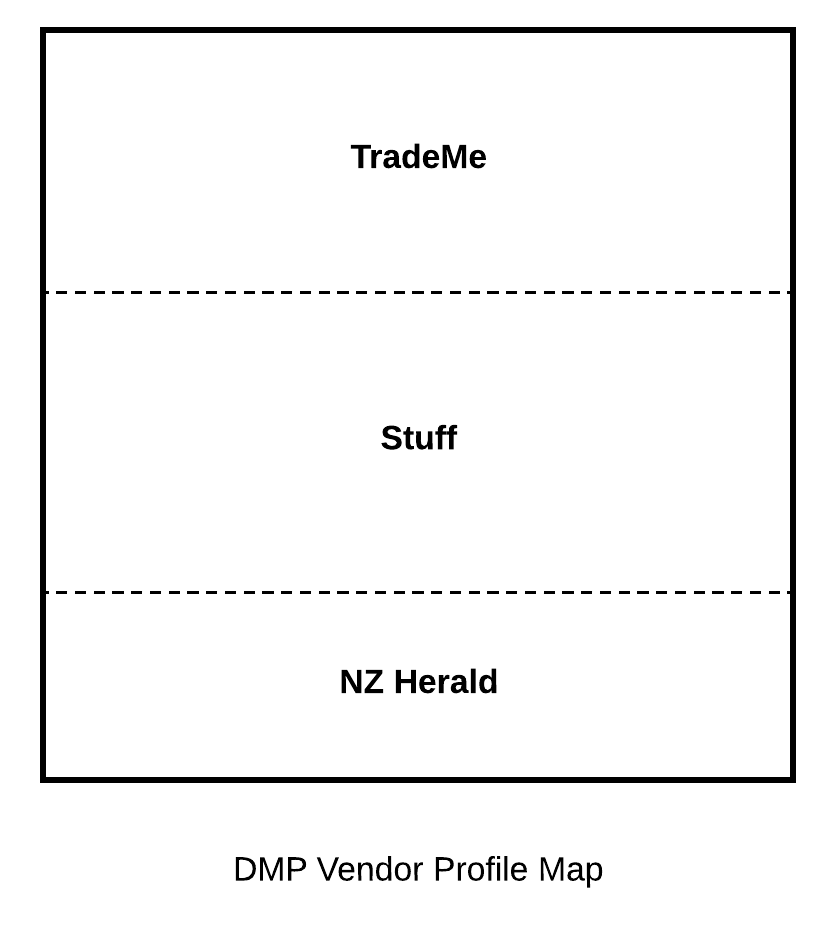
A DMP Vendor in New Zealand claims to have 4 Million Unique profiles and 20 Million Device IDs in New Zealand. The total population of the country as of 2015 is 4.596 Million people (Source).
Their existing Clientele includes the following top Websites (derived from Alexa’s Ranking):
The above websites each contribute the following amount of IDs to the DMP Vendor Platform:
NOTE : All the numbers presented below are hypothetical and bear no resemblances to any real-life data. They are merely presented as follows in this case for educational purposes.
Client
Total Contributed Profiles (Million)
Total Contributed Unique Profiles (Million)
TradeMe
3.75
1.5
Stuff
4.1
1.75
NZ Herald
3.25
0.75
The above profile map can be visualized as follows:
From the (hypothetical) data above, the DML Profile map does have a Supply Side slant which does mean that an Organization considering them can expect that the Unique Profiles and their activated ID sets to be constantly refreshed - given habitual behaviour of user who will frequently visit content sites.
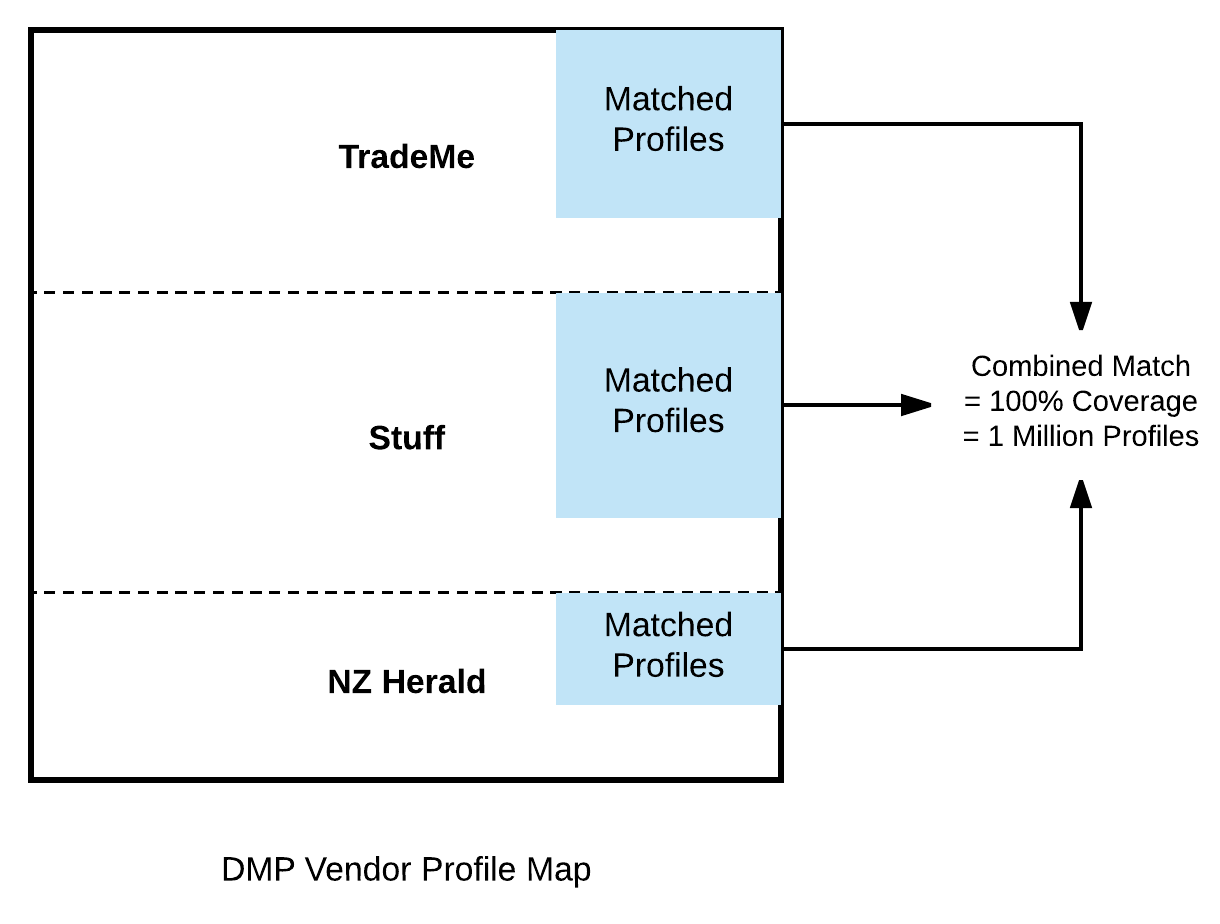
Assuming as an Organization - one is looking to activate 1 Million user IDs through datasets that have been collected within the existing Enterprise CRM and is considering the DMP Vendor above as the platform of choice. Given the vast footprint of this DMP within the New Zealand market, the Organization has achieved a Match Rate of 100% with their existing Profile Map Dataset (NOTE: This is highly improbable in a real life scenario - given that some Clients will choose not to share their activated IDs within the marketplace and a DMP Vendor might not have this large a market coverage - which is what make datasets from large social platforms like Facebook or service platforms like Google extremely valuable).
The 100% Profile Map can be visualized as follows:
In the visualization above, the colored sections demonstrate the contribution made by each existing Client (namely TradeMe, Stuff and NZ Herald) in activating the Organization’s datasets and achieving a 100% Match Rate.
For demonstration purposes, the case will assign percentages to each match contribution to drive the importance of Vendor-Client contribution and how it should influence the evaluation of a DMP.
Client
% of Match Contribution
TradeMe
35
Stuff
50
NZ Herald
15
Given the data above, if one of the existing Clients decides not to contribute to the pool either by privatizing the ID or by changing Vendors, the ‘Match Rate’ achieved by the potential-Client Organization will reduce by the ‘Match Contribution Percentage’ highlighted in the table above.
Eg: If TradeMe decided to switch vendors, the Organization will only achieve a 65% Match Rate with the DMP Platform above and will have to increase the Match Rate organically over time by seeding the pool of IDs and profiles.
IDs (and their associated attributes) collected within a DMP rely primarily on the sources of data as per the aforementioned factors. In those factors, the goal of the assessment was to identify the types of IDs that may be available within the platform and (to a certain extent), if they can be leveraged to create an activated dataset for Organizational datasets.
This factor takes the above a little further by assessing the integrations offered by the DMP for the ingress and egress of data.
To expand on this point, the document will introduce the role of ‘Data Contributor’ and ‘Data Consumer’ defined as follows:
Data Contributor:
Can be defined as the platform that sends data to the DMP via an integration or use of alternate methods such as FTP
Can be defined as the platform that receives and subsequently uses data derived from the DMP through (though not necessarily limited to) APIs
Examples include: Demand Side Platforms (DSP) and/or Supply Side Platforms (SSP)
NOTE: It is important to highlight that Data Ingress and Egress for the aforementioned should not be assessed statically as a one way transaction but how a DMP can assist in completing the loop - so to speak.
Eg: How does an Organization tie a User who has click on a winning ad served by their DSP and converted digitally on their website which is recorded in their CRM and subsequently updated back in their DMP and DSP to prevent the DSP from retargeting the converted user? How fast does the DMP close the loop? Can the DMP update based on the digital activity and not necessarily an offline update?
While there are quite a few more DMP Evaluation Criteria that can be considered when selecting a DMP, this document will not cover them within this iteration but instead will choose to focus on those factors in future papers that will serve together with this current iteration as a collective series of considerations that can subsequently be developed into a framework for Organizations irrespective of size, scale, geography and budget.
This document however seeks to lay the foundation of ‘Match Rates’ and ‘Data Activation’ as concepts that will be further explored down the line across the entire AdTech and/or MarTech stack.